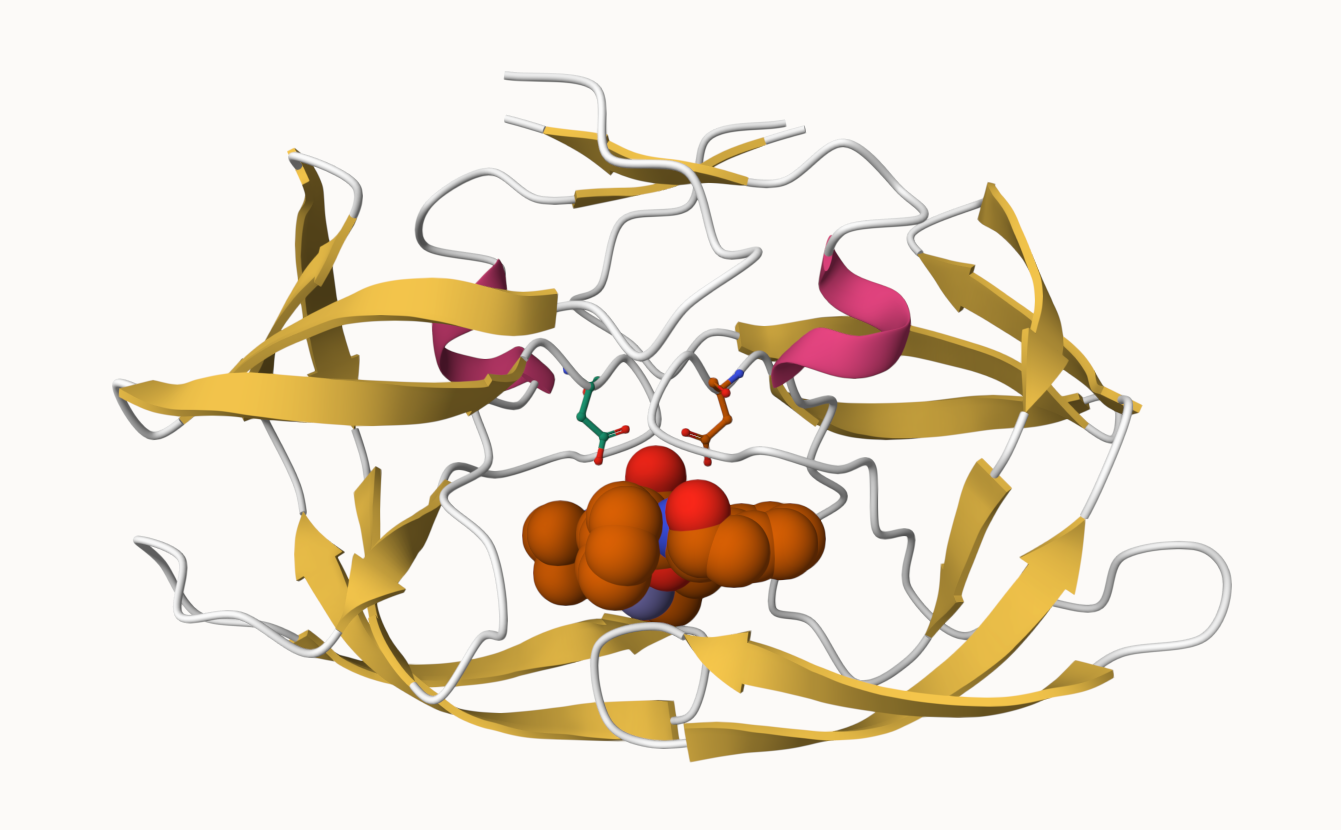
Q. Generate and insert an image of the HIV-Pr cartoon colored by secondary strucure, showing the inhibitor (ligand) in ball and stick.
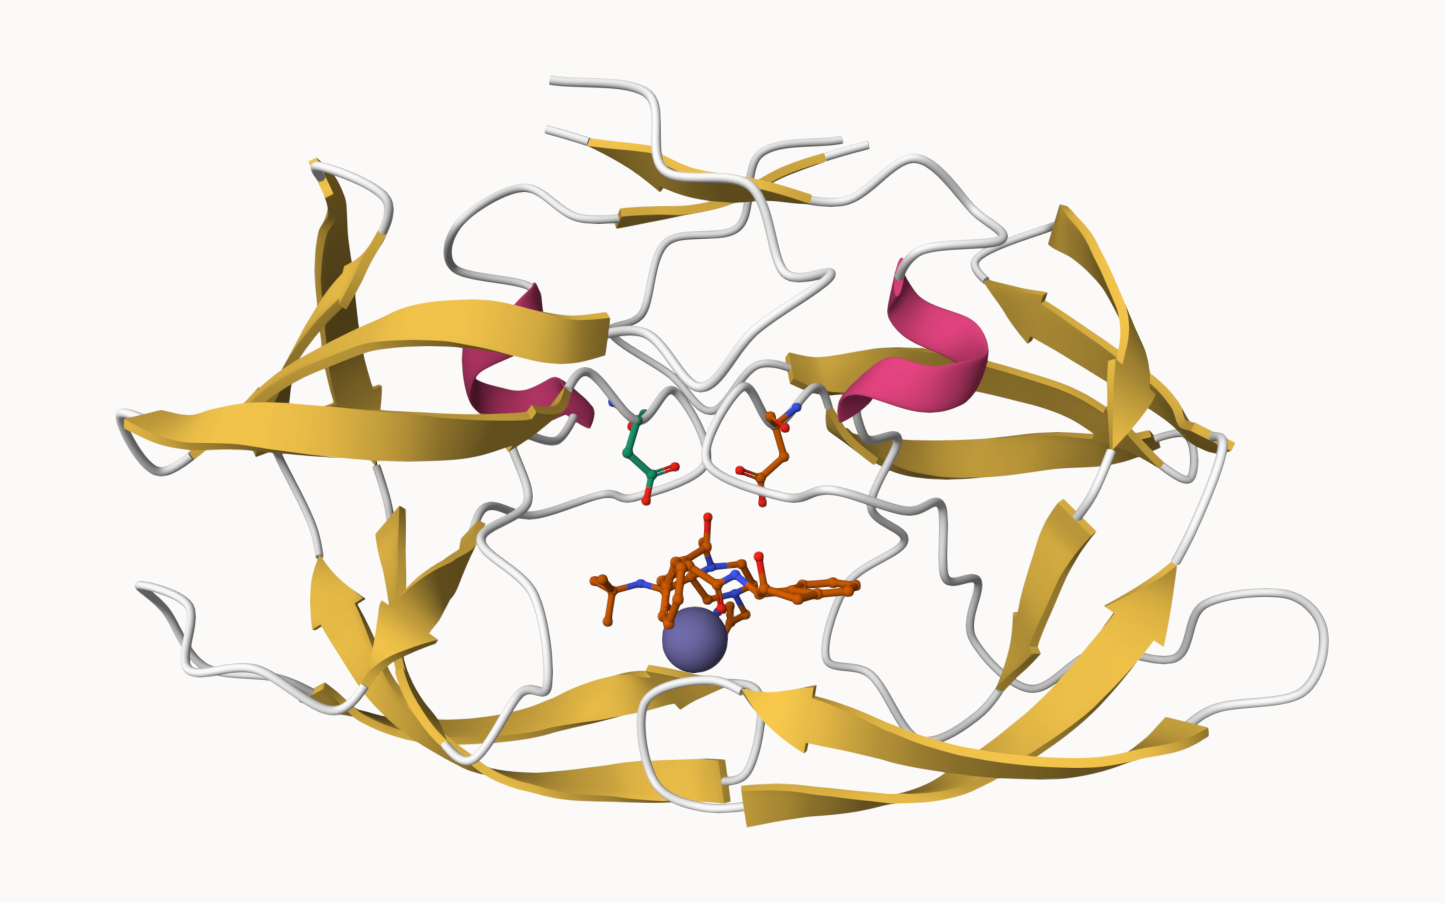
Generate an insert an image of the HIV-Pr cartoon of the water molecule
>Q4: Water molecules normally have 3 atoms. Why do we see just one atom per water molecule in this structure?
We only see one atom per water molecule in this structure because the hydrogens of water are not resolved, meaning the PDB is only showing the oxygen atom.
Q5: There is a critical “conserved” water molecule in the binding site. Can you identify this water molecule? What residue number does this water molecule have
HOH 308, chain A
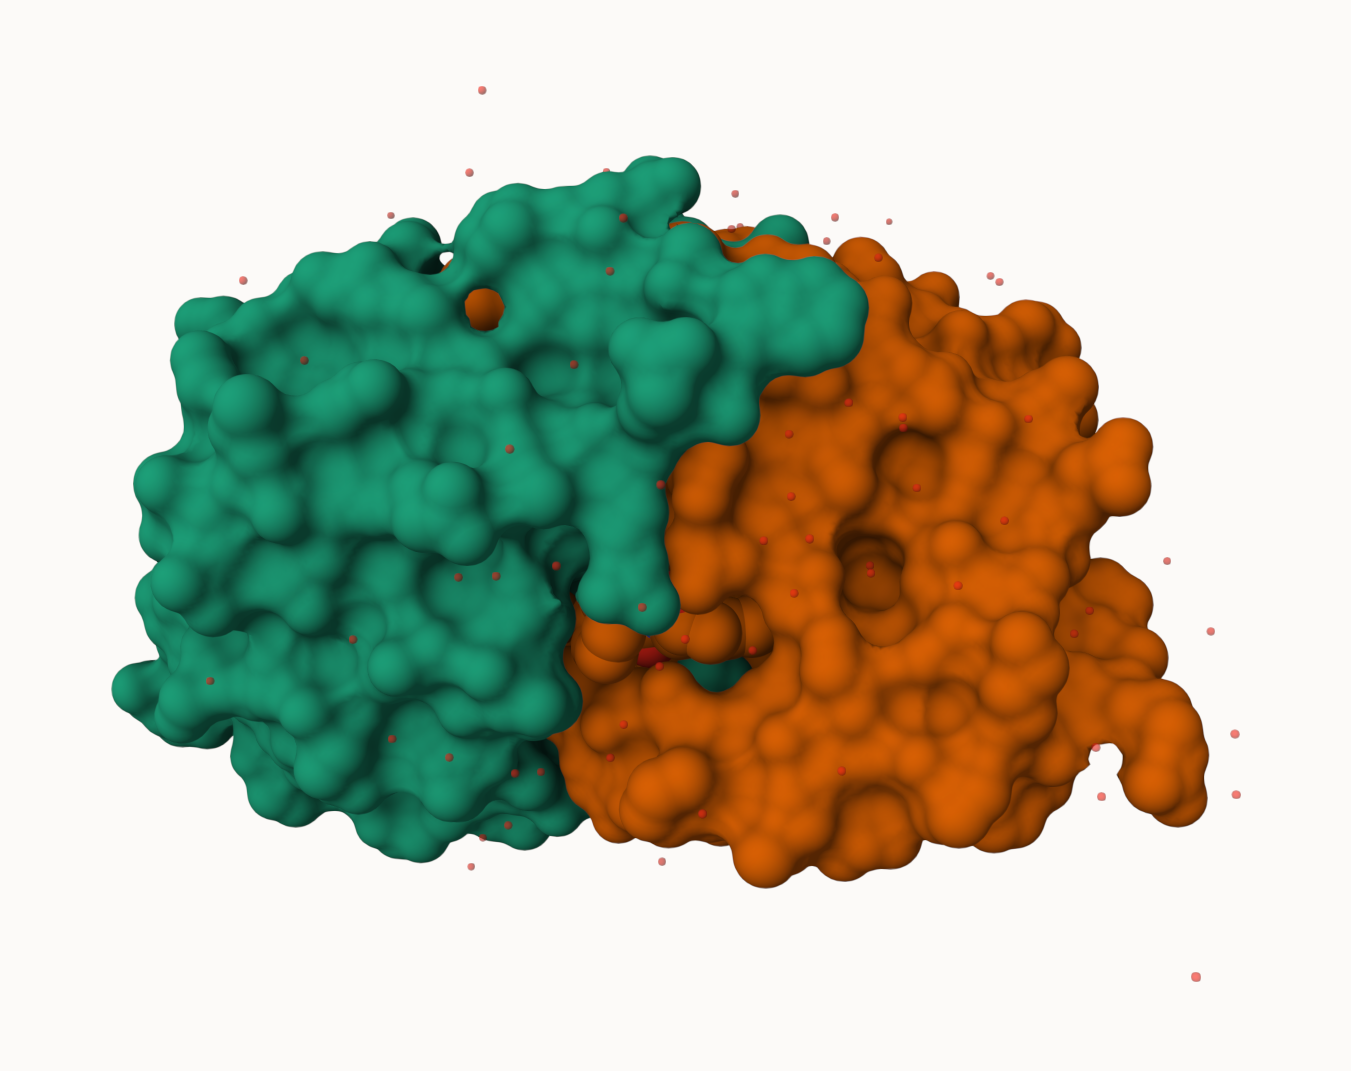
Q6: Generate and save a figure clearly showing the two distinct chains of HIV-protease along with the ligand. You might also consider showing the catalytic residues ASP 25 in each chain and the critical water (we recommend “Ball & Stick” for these side-chains). Add this figure to your Quarto document.
The Bio3D package for structural bioinformatics
library(bio3d)hiv <-read.pdb("1hsg")
Note: Accessing on-line PDB file
hiv
 Call:  read.pdb(file = "1hsg")

   Total Models#: 1
     Total Atoms#: 1686,  XYZs#: 5058  Chains#: 2  (values: A B)

     Protein Atoms#: 1514  (residues/Calpha atoms#: 198)
     Nucleic acid Atoms#: 0  (residues/phosphate atoms#: 0)

     Non-protein/nucleic Atoms#: 172  (residues: 128)
     Non-protein/nucleic resid values: [ HOH (127), MK1 (1) ]

   Protein sequence:
      PQITLWQRPLVTIKIGGQLKEALLDTGADDTVLEEMSLPGRWKPKMIGGIGGFIKVRQYD
      QILIEICGHKAIGTVLVGPTPVNIIGRNLLTQIGCTLNFPQITLWQRPLVTIKIGGQLKE
      ALLDTGADDTVLEEMSLPGRWKPKMIGGIGGFIKVRQYDQILIEICGHKAIGTVLVGPTP
      VNIIGRNLLTQIGCTLNF

+ attr: atom, xyz, seqres, helix, sheet,
        calpha, remark, call
Q7: How many amino acid residues are there in this pdb object?
There are 198 amino acid residues in this pdb object.
Q8: Name one of the two non-protein residues?
One of the two non-protein residues is MK1.
Q9: How many protein chains are in this structure?
  type eleno elety  alt resid chain resno insert      x      y     z o     b
1 ATOM     1     N <NA>   PRO     A     1   <NA> 29.361 39.686 5.862 1 38.10
2 ATOM     2    CA <NA>   PRO     A     1   <NA> 30.307 38.663 5.319 1 40.62
3 ATOM     3     C <NA>   PRO     A     1   <NA> 29.760 38.071 4.022 1 42.64
4 ATOM     4     O <NA>   PRO     A     1   <NA> 28.600 38.302 3.676 1 43.40
5 ATOM     5    CB <NA>   PRO     A     1   <NA> 30.508 37.541 6.342 1 37.87
6 ATOM     6    CG <NA>   PRO     A     1   <NA> 29.296 37.591 7.162 1 38.40
  segid elesy charge
1  <NA>     N   <NA>
2  <NA>     C   <NA>
3  <NA>     C   <NA>
4  <NA>     O   <NA>
5  <NA>     C   <NA>
6  <NA>     C   <NA>
  Note: Accessing on-line PDB file
   PDB has ALT records, taking A only, rm.alt=TRUE
m <-nma(adk)
 Building Hessian...        Done in 0.014 seconds.
 Diagonalizing Hessian...   Done in 0.049 seconds.
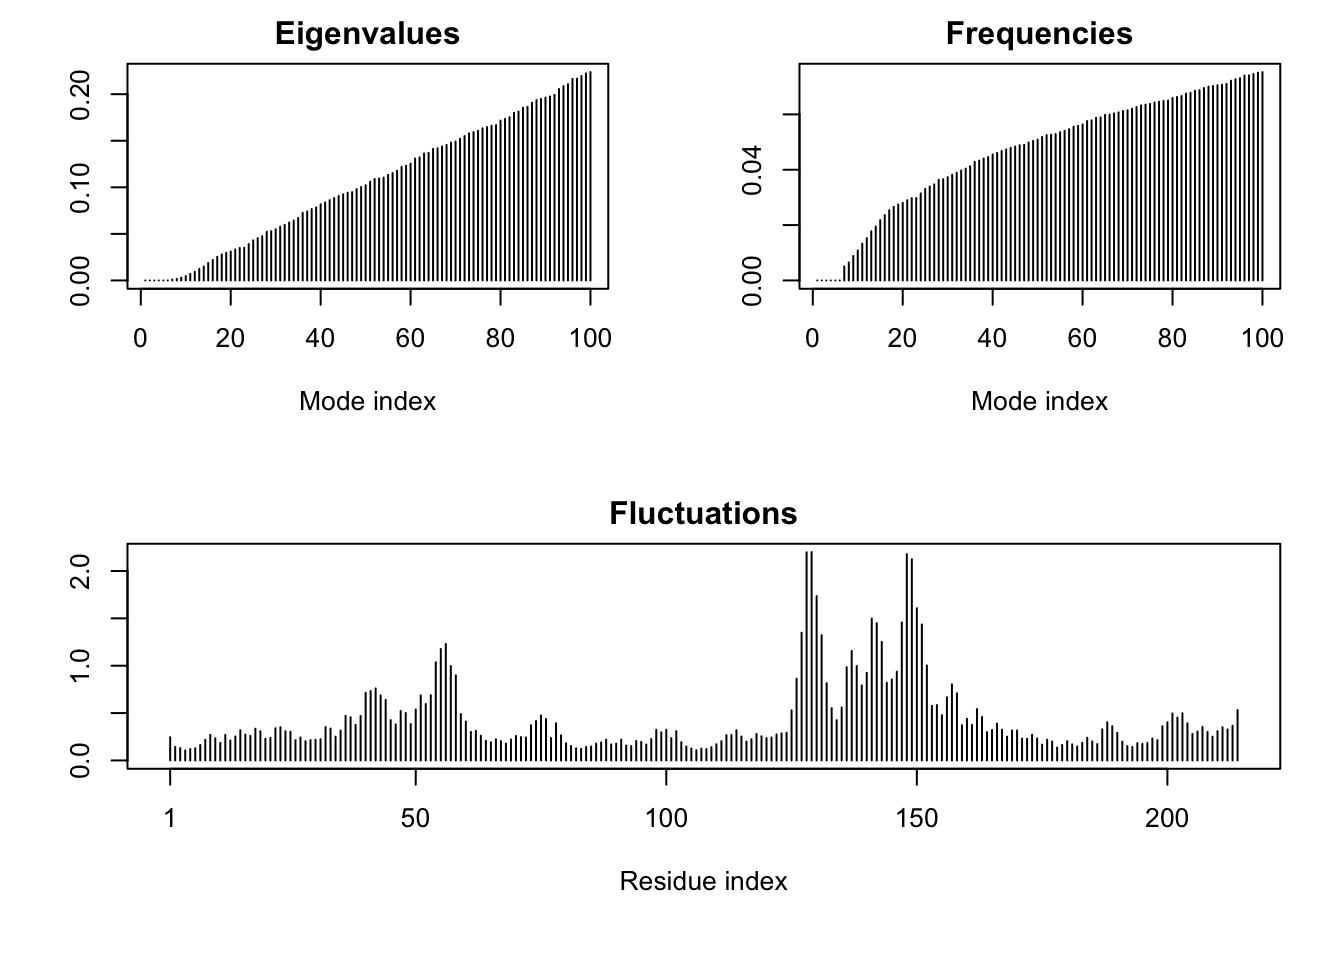
plot(m)
Q14. What do you note about this plot? Are the black and colored lines similar or different? Where do you think they differ most and why?
The colored lines seem mostly similar but seem to change in the flexible parts of the protein. They most likely move the most during the open and closing conformational change.
Write out our results as a wee trajectory movie:
mktrj(m, file="results.pdb")
Comparitive protein structure analysis with PCA
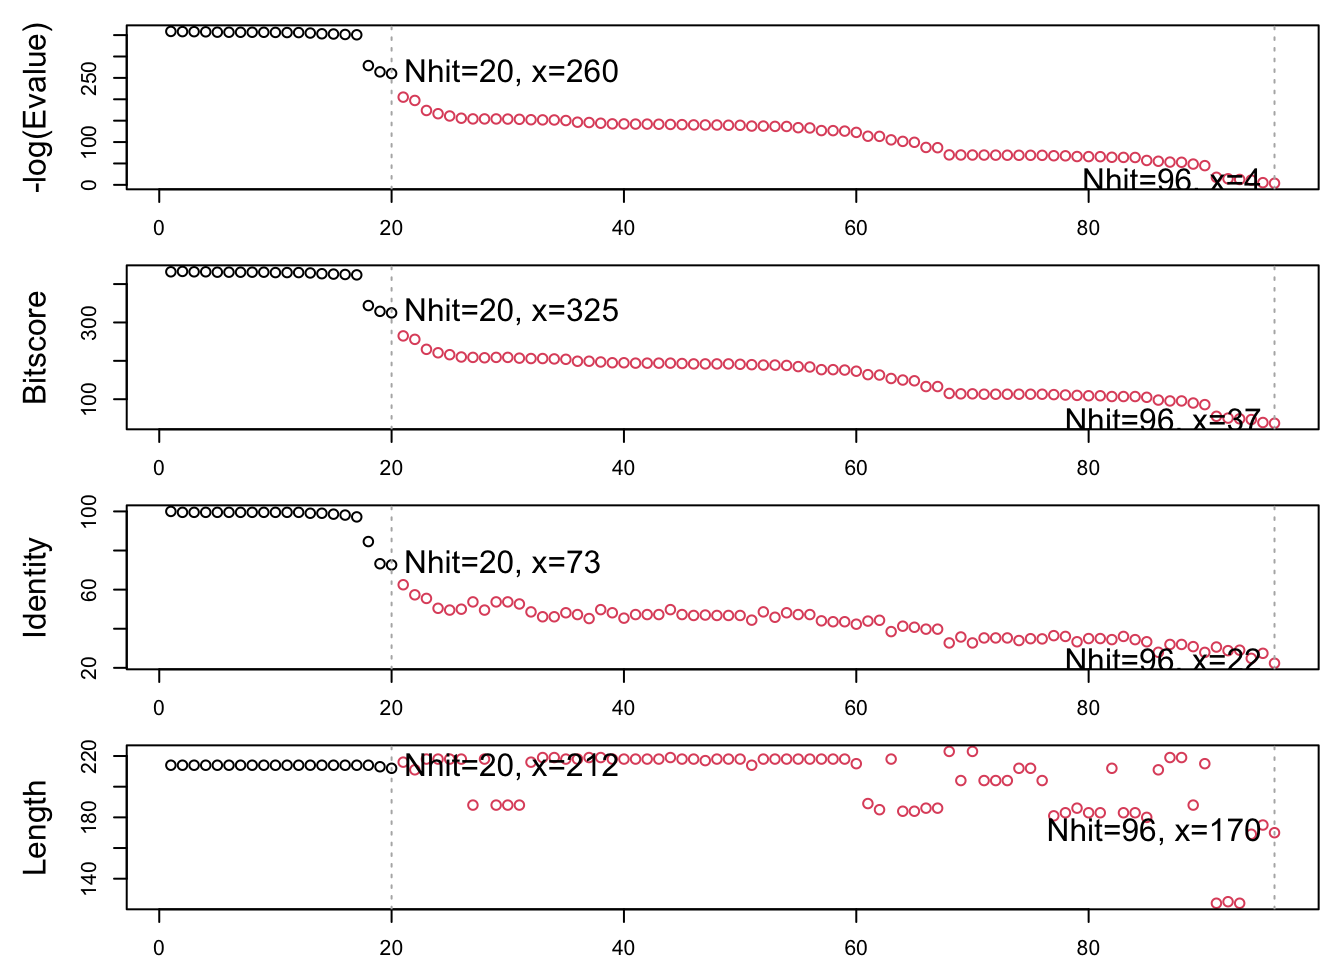
We start with a database id “1ake_A”
library(bio3d)id <-"1ake_A"aa <-get.seq(id)
Warning in get.seq(id): Removing existing file: seqs.fasta
We need one package from BioConductor. to set this up we need to first install a package called “BiocManager” from CRAN.
Now we can use the install() function from this package like this:
BiocManager::install("msa)
pdbs <-pdbaln(files, fit =TRUE, exefile="msa")
Reading PDB files:
pdbs/split_chain/1AKE_A.pdb
pdbs/split_chain/8BQF_A.pdb
pdbs/split_chain/4X8M_A.pdb
pdbs/split_chain/6S36_A.pdb
pdbs/split_chain/9R6U_A.pdb
pdbs/split_chain/9R71_A.pdb
pdbs/split_chain/8Q2B_A.pdb
pdbs/split_chain/8RJ9_A.pdb
pdbs/split_chain/6RZE_A.pdb
pdbs/split_chain/4X8H_A.pdb
pdbs/split_chain/3HPR_A.pdb
pdbs/split_chain/1E4V_A.pdb
pdbs/split_chain/5EJE_A.pdb
pdbs/split_chain/1E4Y_A.pdb
pdbs/split_chain/3X2S_A.pdb
pdbs/split_chain/6HAP_A.pdb
pdbs/split_chain/6HAM_A.pdb
pdbs/split_chain/8PVW_A.pdb
pdbs/split_chain/4K46_A.pdb
pdbs/split_chain/4NP6_A.pdb
   PDB has ALT records, taking A only, rm.alt=TRUE
.   PDB has ALT records, taking A only, rm.alt=TRUE
..   PDB has ALT records, taking A only, rm.alt=TRUE
.   PDB has ALT records, taking A only, rm.alt=TRUE
.   PDB has ALT records, taking A only, rm.alt=TRUE
.   PDB has ALT records, taking A only, rm.alt=TRUE
.   PDB has ALT records, taking A only, rm.alt=TRUE
.   PDB has ALT records, taking A only, rm.alt=TRUE
..   PDB has ALT records, taking A only, rm.alt=TRUE
..   PDB has ALT records, taking A only, rm.alt=TRUE
....   PDB has ALT records, taking A only, rm.alt=TRUE
.   PDB has ALT records, taking A only, rm.alt=TRUE
.   PDB has ALT records, taking A only, rm.alt=TRUE
..

Extracting sequences

pdb/seq: 1   name: pdbs/split_chain/1AKE_A.pdb
   PDB has ALT records, taking A only, rm.alt=TRUE
pdb/seq: 2   name: pdbs/split_chain/8BQF_A.pdb
   PDB has ALT records, taking A only, rm.alt=TRUE
pdb/seq: 3   name: pdbs/split_chain/4X8M_A.pdb
pdb/seq: 4   name: pdbs/split_chain/6S36_A.pdb
   PDB has ALT records, taking A only, rm.alt=TRUE
pdb/seq: 5   name: pdbs/split_chain/9R6U_A.pdb
   PDB has ALT records, taking A only, rm.alt=TRUE
pdb/seq: 6   name: pdbs/split_chain/9R71_A.pdb
   PDB has ALT records, taking A only, rm.alt=TRUE
pdb/seq: 7   name: pdbs/split_chain/8Q2B_A.pdb
   PDB has ALT records, taking A only, rm.alt=TRUE
pdb/seq: 8   name: pdbs/split_chain/8RJ9_A.pdb
   PDB has ALT records, taking A only, rm.alt=TRUE
pdb/seq: 9   name: pdbs/split_chain/6RZE_A.pdb
   PDB has ALT records, taking A only, rm.alt=TRUE
pdb/seq: 10   name: pdbs/split_chain/4X8H_A.pdb
pdb/seq: 11   name: pdbs/split_chain/3HPR_A.pdb
   PDB has ALT records, taking A only, rm.alt=TRUE
pdb/seq: 12   name: pdbs/split_chain/1E4V_A.pdb
pdb/seq: 13   name: pdbs/split_chain/5EJE_A.pdb
   PDB has ALT records, taking A only, rm.alt=TRUE
pdb/seq: 14   name: pdbs/split_chain/1E4Y_A.pdb
pdb/seq: 15   name: pdbs/split_chain/3X2S_A.pdb
pdb/seq: 16   name: pdbs/split_chain/6HAP_A.pdb
pdb/seq: 17   name: pdbs/split_chain/6HAM_A.pdb
   PDB has ALT records, taking A only, rm.alt=TRUE
pdb/seq: 18   name: pdbs/split_chain/8PVW_A.pdb
   PDB has ALT records, taking A only, rm.alt=TRUE
pdb/seq: 19   name: pdbs/split_chain/4K46_A.pdb
   PDB has ALT records, taking A only, rm.alt=TRUE
pdb/seq: 20   name: pdbs/split_chain/4NP6_A.pdb
Let’s have a peak at our structures after “fitting” or superposing:
library(bio3dview)view.pdbs(pdbs)
view.pdbs(pdbs, colorScheme="residue")
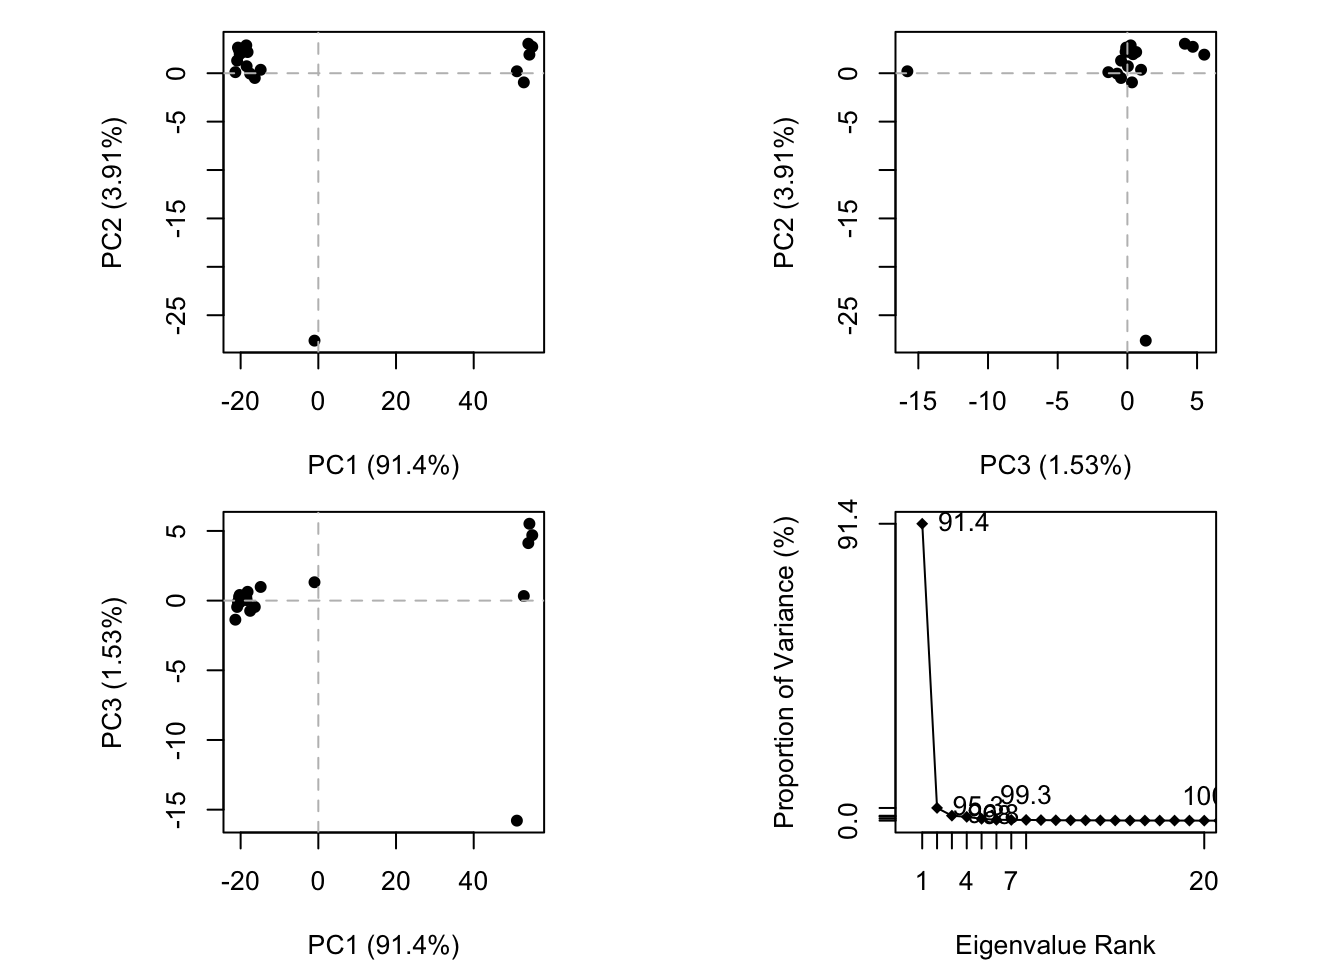
We can run functions like rmdsd(), rmsf() and the best pca()
pc.xray <-pca(pdbs)plot(pc.xray)
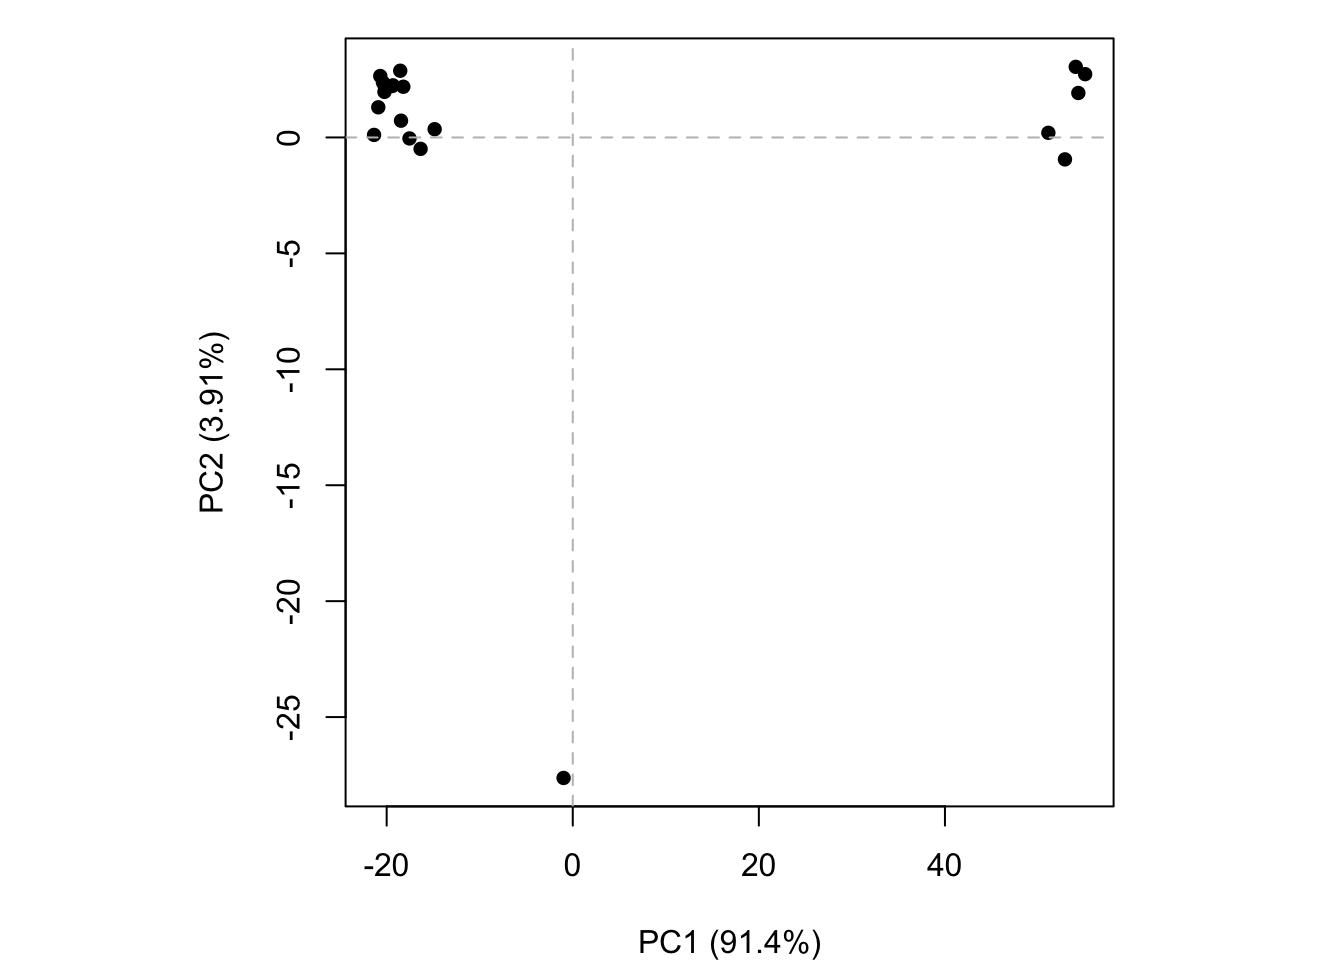
plot(pc.xray, 1:2)
Finally, let’s make a movie of the major “motion” or structure difference in the dataset - we call this a “trajectory”.
 >Q4: Water molecules normally have 3 atoms. Why do we see just one atom per water molecule in this structure?